
HE Opaque Quartz Vs Commercially Available Opaque Quartz
In my previous post I discuss the difference types of quartz and how product purity is mostly determined by the extent of refinement of the raw material and the quality control of the manufacturer. This is particularly true for the opaque quartz as contaminants can be more easily hidden in the material due to the materials opacity as I am about to show you.
This became apparently obvious to me after ordering a knock off import Gavel to compare to our original product. Just looking at the two materials side by side there was clearly a difference in color. The imported opaque looked several shades darker in color.
 [Photo 1] Top: HE Opaque Quartz (Sample A1)
Bottom: Commercially Available Opaque Quartz (Sample A2)
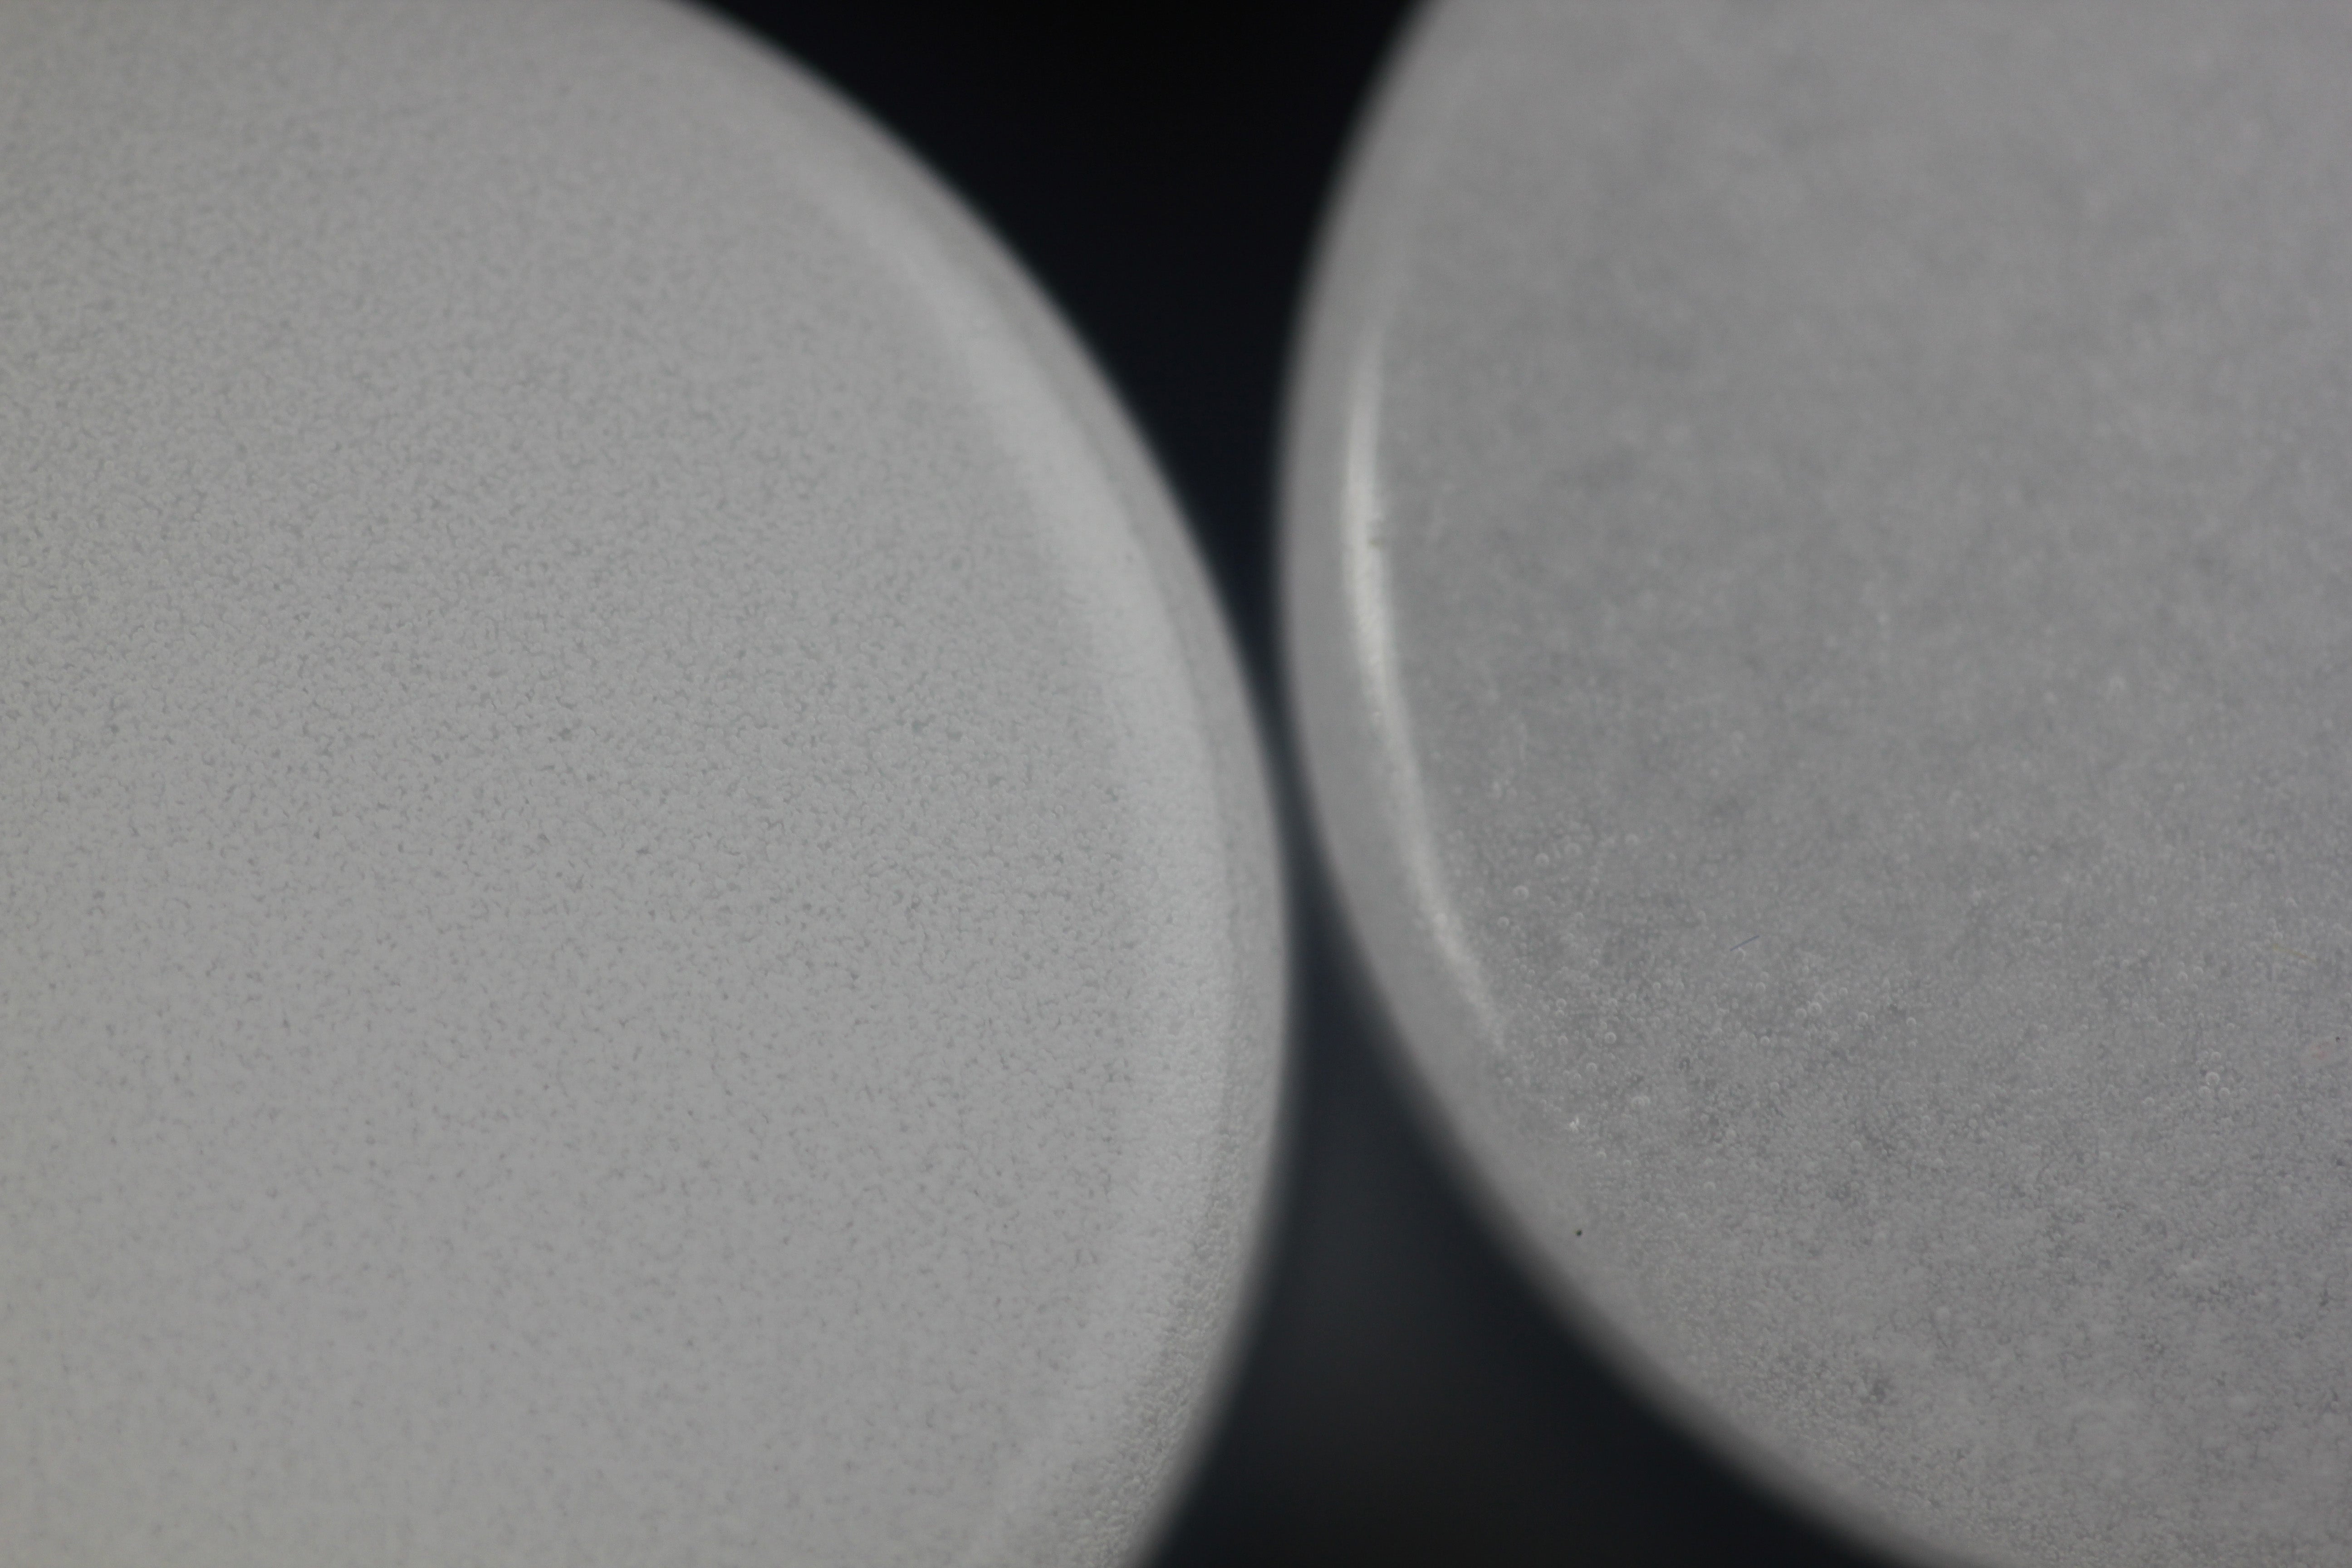
The difference in appearance piqued my curiosity so I took photos of the materials side by side with a macro lens to get more detail on why the products might differ. After reviewing the photos, the macro lens revealed many anomalies that seemed to occur within the A2 sample. I will include some of my photos below with the anomalies highlighted.  [Photo 2] Left: Sample A1 Right: Sample A2
By opening this image in a new tab, you should be able to zoom in to the two materials to see the differences in both cell size and cell density. If you look at the area that is in focus in Sample A2, you may also notice a small blue colored filament, and below that to the left; a small black contaminant. Subsequent investigations made sure that this filament was not something on the lens, or on the surface of the glass and that it was indeed contained within the body of the sample. After visually discovering contaminants within the A2 sample, more photos were taken to document the anomalies.
[Photo 3] Sample A2 with some contaminants identified. [Photo 4] Sample A2 with many contaminants in focal depth. (open in new tab for full resolution)


 [Photo 4.1-4.3] 4.1 Shows a zoomed in section of Photo 4 showing either the same or similar blue colored filament from Photo 2. Photos 4.2 and 4.3 show a zoomed in section of unidentified contaminants in Photo 4 right and center.
 [Animation 1] Another filament found within the Sample A2. Animation shifts focal depth to demonstrate materials contained within the sample.
After discovering the anomalies in the material, I enlisted the help of a materials lab at a local university to perform an in depth analysis of the differences between Sample A1 (HE) and Sample A2 (Commercially Available Opaque). The materials lab conducted mechanical testing, SEM imaging with elemental analysis (EDS), and BET surface area analysis on the materials. Excerpts from the results follow.
The samples in this report were tested for differences between them. For that purpose, the discrepancies between the two samples are focused on more heavily than the similarities. The conclusions in this report may be subject to reinterpretation based on any knowledge we gain about the samples’ production or handling.
1. Mechanical testing:
For the mechanical testing Instron tests were set up using a 3-point bend attachment. The disks were placed on the base, and the upper arm was lowered at a rate of 1mm/min onto the samples. The load in newtons was measured until they broke. The compiled data is contained in the Table 1 and Figure 2. We noticed that the A1 disc broke first and in relatively straight lines. This allowed us to run 3 separate tests on the A1. Sample A2 broke more explosively and with seemingly random break patterns, allowing the test to be conducted only once. While mechanical testing generally requires 20 or more samples to be statistically significant, this seems to imply that sample A1 contained more cells and had a higher cell density than did A2, leading it to break more easily and uniformly. [Author comment: More on cell size and density later, so keep that in mind.]
2.1: A1 Elemental Analysis
On the interior sample of A1, we found no traces of anything other than oxygen and silicon, which are to be expected. The summary of our internal quantification (taking the gold out of the calculation) is found in Table 2.
[Author comment: The lab technician explained to me that they put a thin layer of gold on the surface of the material to get good SEM images, and that was showing up in the elemental analysis and that is why it is being disregarded.]

2.2 A2 Elemental Analysis
On the interior sample of A2 we found evidences of carbon, oxygen, and silicon. The summary of our internal quantification (taking the gold out of the calculation) is found in Table 4. The software identified less than 1% of Al, which was not included on the table as it was determined by the lab to be an insignificant amount. As can be seen, there was a fairly large variation between the amount of carbon in quantification 1 and 2. This could indicate that some regions were slightly more carbon-rich than others.

3: SEM - Imaging
SEM was used for digital imaging, as well as elemental analysis through an EDS attachment. The images taken were through two different SEMs: a Hitachi SEM TM3030Plus, and a Hitachi S-3000N. The S-3000n has the EDS attachment, so all related elemental analyses were taken through that microscope.
3.1 TM3030Plus Imaging
From our survey of A1 and A2, there were crystalline stars found on the surface of both, in about the same size range. There were semi-sphere holes on the surface of A1 that didn't seem to be replicated on the surface of A2, and carbonaceous material in A2 that was not found in A1. 
Surface of A1 and A2 at 40x Magnifaction. [Author comment: The semi-sphere holes on the surface are what serve as active nucleation sites during the chemical separation process. The damage seen on the surface of A2 could've been caused when I removed it from the banger with a radial saw. Damage aside, you can clearly see a difference in quality of cell uniformity between the two surfaces.]

The black spots in the A2 sample were EDS mapped and found to be carbon components as shown in Figure 4. More than one black spot could be seen on the surface and the presence of carbon in the interior quantification implied that this was contamination from a production process involved with the A2 sample. 

The crystal stars on the surface of A1 and A2 were mapped and determined to contain potassium, chlorine, and sodium as shown in Figure 5. The mapping at a higher magnification (crystal zoomedes) showed clearer results about the locations of the elements in the crystal "field". These crystals were salts which are common in tap water, or sweat. They were not found inside the material but were found fairly abundant on the exterior implying they were left over from handling or washing. 
4. Surface Area
The reports returned from our surface area analyzer contain both raw and analyzed data. They are organized into four parts: isotherm report, isotherm plot, BET report, and BET plot.
The isotherm data is the raw data collected by the computer. It is measured in quantity adsorbed (volume of gas adsorbed onto the surface of the sample per gram of sample) versus adsorption relative pressure (which is the current pressure of nitrogen in the tube over a standard pressure value, which we calibrate for at the beginning of the day).
The isotherm data is linearized using the BET equation, and the slope and intercept of the line are used to calculate surface area in area (m2) per gram of sample. These numbers are reported in the BET data.
The reported BET surface area of sample A1 was 0.4564 ± 0.1414 m2/g.
The reported BET surface area of sample A2 was 0.3554 ± 0.0402 m2/g.
While there were not enough samples tested to be completely conclusive, it appears that A1 had a larger surface area, indicating more pores. This corroborates the Instron testing of the samples which also seemed to show that A1 was more porous. [Author comment: Surface area is one of the variables in the thermal transfer equation. Greater surface area is greater thermal transfer. Furthermore, more pores equals more active nucleation.]
This concludes the excerpts from the report.
So now, lets discuss 3 ways opaque quartz can differ:
- Purity
- Cell Size
- Cell Density
Purity: Conventional opaque quartz glass produced from natural materials and blowing agents contains over 1 ppm of impurities such as Na and Fe. According to the manufacturer, the opaque quartz Highly Educated sources has impurities in less than 1 ppm, if any and that was reaffirmed by the elemental data analysis. The purity of the commercially available opaque was certainly challenged as it didn't look right to begin with, contaminants were discovered with a regular macro lens, and then subsequent SEM imaging and multiple elemental data analyses had it containing as much as 43% carbon by atomic weight. The Highly Educated opaque contained only Silicon and Oxygen, pure SiO2.
Cell Purpose: The bubbles, or cells, in the material contribute to the materials ability to intercept heat radiation. Bubbles contained within the material are referred to as closed cells, and bubbles that have intersected with the surface are referred to as open cells. Since heat radiation reflects on the surface of each cell contained in the material, the dimension and density of the cells contained within directly impacts the materials capability to intercept heat radiation. Open cells on the surface can also serve as active sites for nucleation to occur.
Cell size and density: Most opaque quartz glass presently used contains closed cells having an average size of more than 50 micrometers in a proportion ranging from 10,000-100,000 cells per 1 cm3, many of the closed cells having sizes of 100 micrometers or more. There is some opaque quartz glass that contains closed cells having an average size of 50 micrometers or less, but the number of the closed cells is still less than 1,000,000 per 1 cm3. Therefore, the whole surface area of the closed cells is inevitably as small as less than 50 cm2 per 1 cm3 resulting in a limited capability of intercepting heat radiation.
Comparatively, according to the manufacturer, the high-purity opaque quartz glass sourced by Highly Educated contains closed cells ranging anywhere from 3,000,000 - 9,000,000 per 1 cm3 and having an average size of 20-40 micrometers. A ratio of closed cells having sizes of 100 micrometers or more to the whole of cells being 1% or less.
By making cells smaller and by increasing their number, and thus by increasing the whole surface are of the cells, the materials ability to intercept heat radiation is enhanced.
Conclusion:
The commercially available opaque quartz can contain contaminants and carbon agents within the material while also having inferior cell size and density. Opaque is manufactured by sintering a highly refined silicon sand, any contaminants that aren't removed from the sand before sintering will be left in the end product.
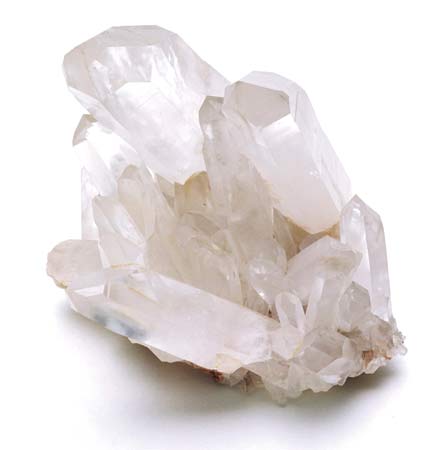
As well as potential contaminants much commercially available opaque has inferior cell size and density. A few examples of inferior cell size and density is shown in the photos below, one I found online [Photo 5] and one I took myself next to one of our products for reference [Photo 6].  [Photo 5]
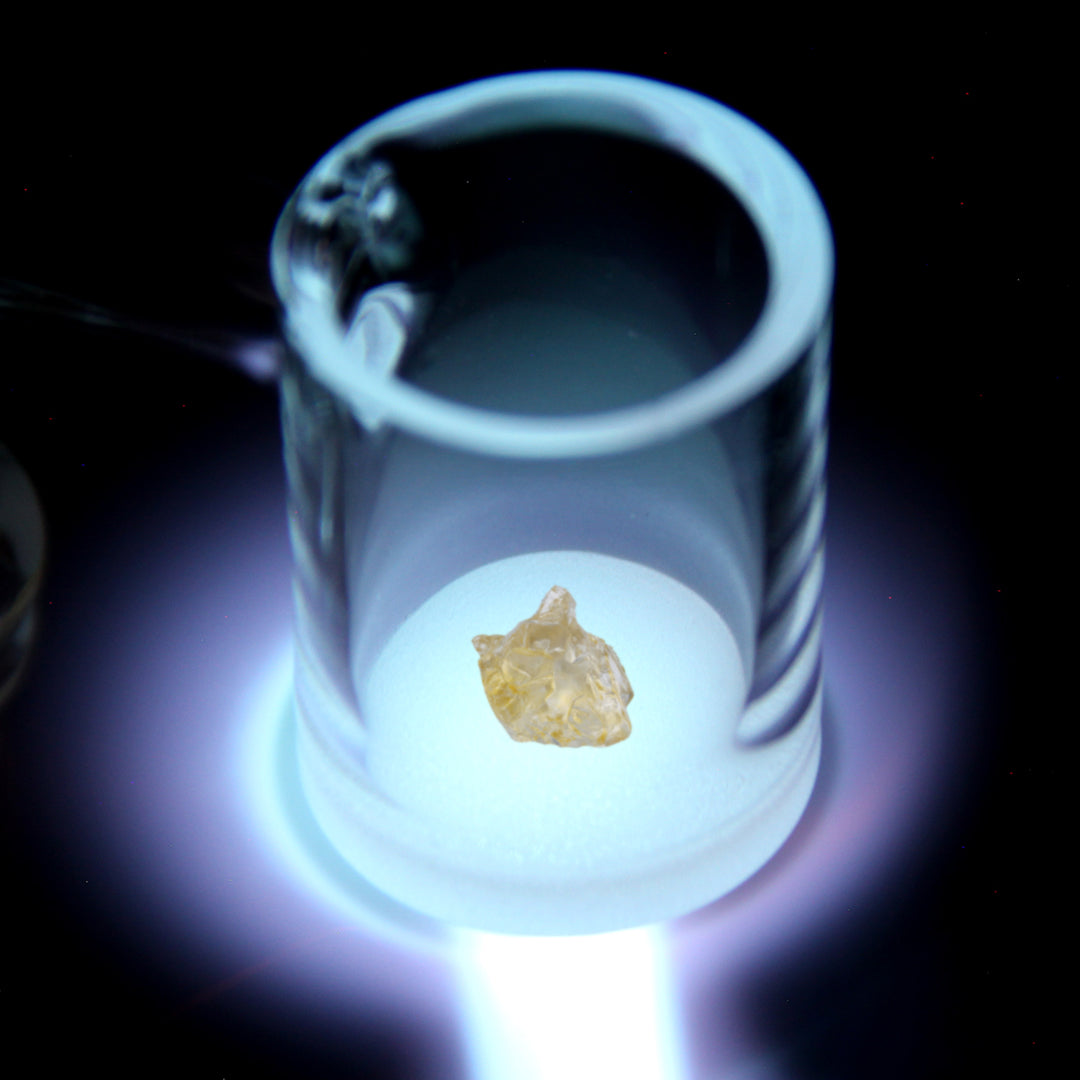
 [Photo 6]
Notice the cell density is so light that the linear transmittance allows you to still see through the material. This has a direct impact on performance. The less cells and cell density, the more the material behaves like traditional quartz. This is why all of our opaque pieces have to pass strict QC process through out the manufacturing process, so that they can all perform. Variations in cell and cell density can result in varied heat up and cool down times. Decreased density yields a decrease in surface area and has a direct impact on the materials ability to intercept heat radiation and the chemical separation process.